Historical simulation VaR by full revaluation
Value at risk answers one question: how much can this book lose in a day, at a given confidence. Historical simulation is the least model dependent way to answer it: replay the market moves that actually happened, reprice the book under each one, and read the loss quantile off the resulting P&L distribution. The usual objection is cost, because done honestly it means repricing everything under every scenario. This post does it honestly for a 100 swap SOFR book over 250 scenarios, every one of them a full curve re-bootstrap and book revaluation through QuantLib, and measures what that actually costs on a desktop CPU: 37 seconds.
The method
- Take a book of trades and a base curve; value the book. That is the base.
- Take 250 observed daily moves of the curve's par quotes, all pillars at once, so cross pillar correlation is preserved by construction.
- For each day: shock the base quotes by that day's move, re-bootstrap the curve, reprice the entire book, record the P&L against the base value.
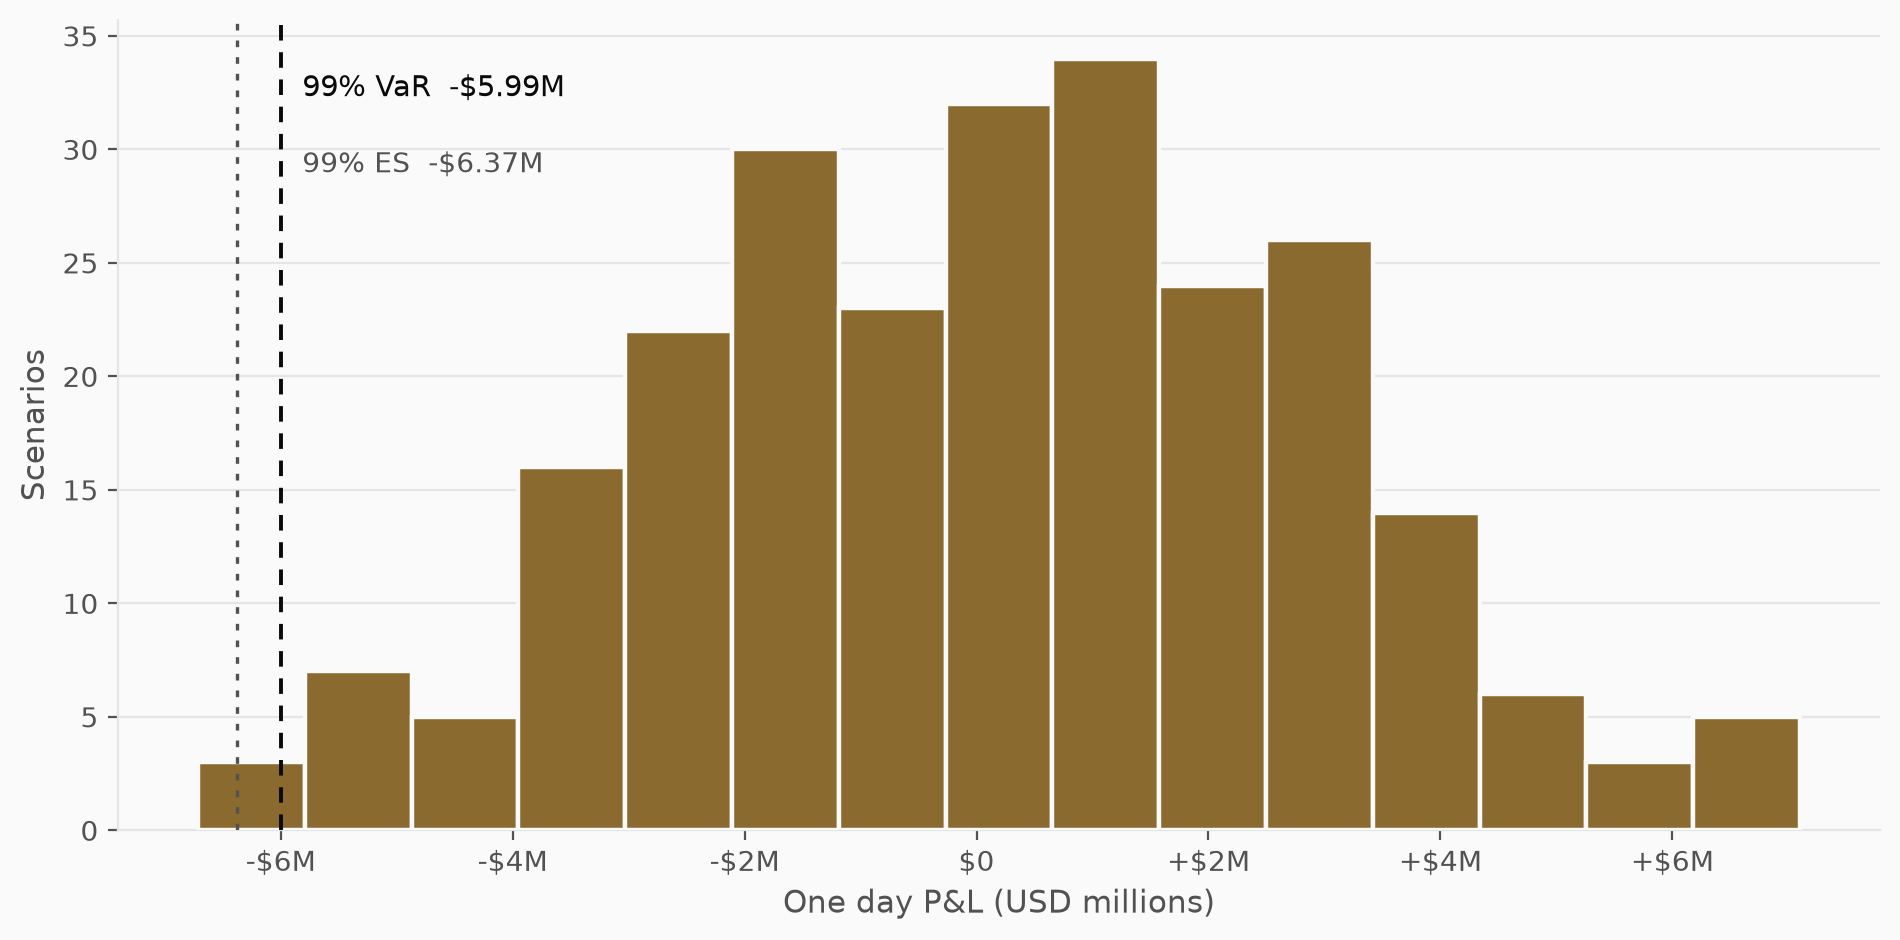
- Sort the 250 P&Ls. The 99% VaR is the loss at the 1% quantile, which for 250 scenarios sits essentially at the second worst outcome. Expected Shortfall is the average loss beyond it.
No Taylor expansion, no DV01 times shift, no precomputed sensitivity ladder, and no pricing model beyond the one already used for the book's daily valuation. What historical simulation assumes is only that the recent past is a fair sample of tomorrow.
The book and the scenarios
The example book is 100 USD SOFR OIS swaps, generated from a fixed seed so every run is reproducible: tenors from 1 to 30 years, round lot notionals of 1 to 50 million, mixed payer and receiver, fixed rates within 25bp of par so every trade carries P&L. The base curve is the 12 pillar SOFR strip from the SOFR post, bootstrapped from OIS quotes with the cleared market conventions.
The daily moves are synthetic but market shaped, and the output labels them as
such: per pillar daily vols from about 1.2bp at one month to 5.6bp at thirty
years, driven by a common level factor with 0.9 correlation plus idiosyncratic
noise. The script takes a CSV of real observed par quote changes instead
(--history-csv), one row per day, at which point the scenario count is
simply the number of rows you supply.
One request per scenario
The engine's JSON API prices a list of trades against market data carried in
the same request. That shapes the whole computation: each scenario is one
POST /price-ois-swap carrying all 100 swaps and that scenario's full shocked
quote set. The server bootstraps the scenario curve once per request, so the
bootstrap cost is amortized across the book instead of being paid per trade.
The 250 requests are independent, so the client fans them out over a thread
pool and the server spreads them across its worker processes, one QuantLib
process per core.
One honest detail: the engine caches bootstrapped curves by content, but that cache cannot help here, because every scenario is by definition a different curve. This workload measures genuine parallel pricing throughput, not cache hits.
The risk numbers
On the seeded example book (all values from the run, reproducible with seed 42):
| Base book value | -$2.13M |
| 99% 1 day VaR | $5.99M |
| 99% Expected Shortfall | $6.37M |
| Worst scenario | -$6.71M P&L, on a day the curve moved -7.5bp on average |
| Best scenario | +$7.10M P&L, on a +8.6bp day |
The one day P&L distribution of the book across the 250 scenarios, every value a full engine revaluation:
What it costs
Measured on a single desktop machine, an AMD Ryzen 9 3900X (12 cores, 24 threads), running the engine container with 24 workers. Each request is one curve bootstrap plus 100 swap repricings and takes about two seconds of QuantLib compute. The same full workload was run at increasing client concurrency:
| Concurrency | Wall time | req/s | Avg latency | Speedup |
|---|---|---|---|---|
| 1 | 488.8 s | 0.5 | 1954 ms | 1.00x |
| 2 | 249.3 s | 1.0 | 1992 ms | 1.96x |
| 4 | 128.6 s | 1.9 | 2045 ms | 3.80x |
| 8 | 70.2 s | 3.6 | 2205 ms | 6.97x |
| 12 | 49.7 s | 5.0 | 2352 ms | 9.84x |
| 24 | 36.8 s | 6.8 | 3349 ms | 13.27x |
Three things to read off that table. Scaling is essentially linear through the 12 physical cores: 1.96x at 2, 3.80x at 4, 9.84x at 12. From 12 to 24 the gain comes from simultaneous multithreading, and it is real but flatter, another 35%: a compute bound QuantLib process does not feed two hardware threads as well as two cores. And per request latency creeping from 2.0 to 3.3 seconds at full width is the ordinary signature of core contention, more requests in flight than physical cores.
The risk numbers are identical at every concurrency level; the run checks this and reports a maximum VaR difference across levels of $0.57 on a $6.0M figure, about 1e-7 in relative terms. Parallelism changes the wall clock, not the numbers.
The sequential baseline makes the point plainly: the same job that takes 8 minutes one request at a time takes 37 seconds with the fan out, on hardware that sits under a desk. Scale the book by 10x and the arithmetic scales with it, since cost is per repricing.
Run it yourself
The example ships with the engine as a single self contained script,
examples/risk_var/historical_var.py (Python standard library plus
requests). Start the engine with one worker per core and point the script
at it:
docker run --rm -e QUANTRA_WORKERS=12 -p 8080:8080 \
  ghcr.io/joseprupi/quantra-server

python3 historical_var.py --url http://localhost:8080
Useful knobs: --swaps and --scenarios for size, --direction payer to
make the book directional, --vol-scale to stress the scenario magnitudes,
--history-csv for real observed moves, --sweep 1,2,4,8,12 to reproduce
the scaling table on your own hardware, and --json for machine readable
output. Keep the client concurrency at or below the server's worker count:
the JSON gateway enforces a fixed 10 second deadline per request that
includes time spent queued.
References
- Jorion, P., Value at Risk: The New Benchmark for Managing Financial Risk (3rd ed., 2006): the standard reference, historical simulation in chapter 10.
- J.P. Morgan/Reuters, RiskMetrics Technical Document (4th ed., 1996): the document that popularized daily VaR methodology.
- QuantLib: every valuation in this post is a QuantLib price.